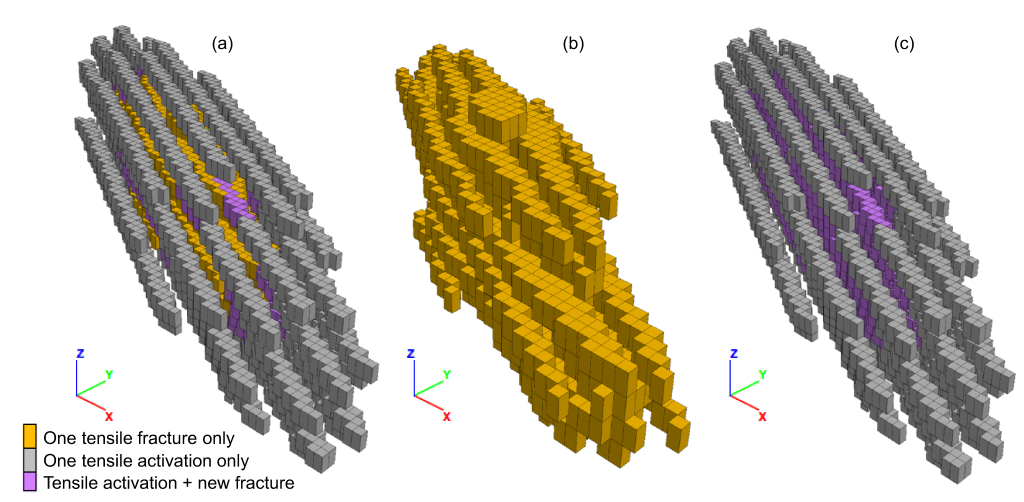
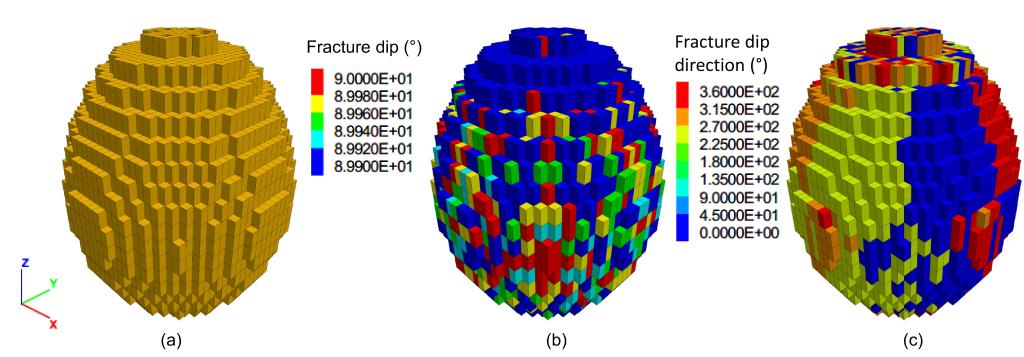
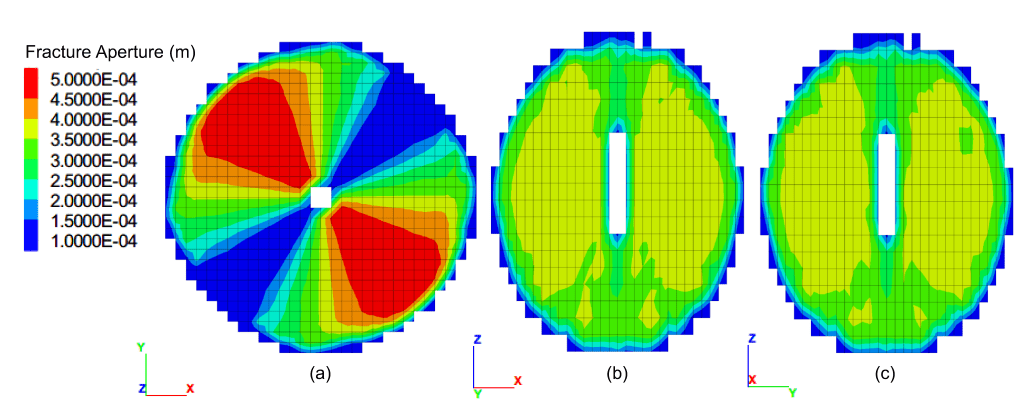
These plots show the zone of fractured rock from numerically simulated hydraulic fracturing due to water injection in a single well, in rock with one set of preexisting fractures of 30° dip and 210° dip direction. Plot (a) shows elements with induced fractures, tension-reactivated preexisting fractures, or both. Plot (b) shows elements with induced fractures only. Plot (c) shows elements with reactivated preexisting fractures. Unfractured rock was excluded from the plots to visualize the fractured interior. Unfractured rock means rock with no new or reactivated fracture. The results indicate that the stimulation zone developed along-strike of the preexisting fractures. More information at https://doi.org/10.1016/j.jrmge.2023.07.009Distribution of fractured rock showing (a) fractured elements, (b) fracture dip, and (c) fracture dip direction: from numerically simulated hydraulic fracturing due to a four-stage water injection in a single well in previously unfractured rock. Unfractured rock was excluded from the plots to visualize the fractured interior. Each plot shows element outlines of dimension 0.5 by 0.5 by1 m. The fractures are all vertical, have predominant strike toward the injection well axis, and a few in the normal direction. More information at https://doi.org/10.1016/j.jrmge.2023.07.009Sections through the fractured-rock zone showing the distribution of fracture aperture from numerically simulated hydraulic fracturing, due to a four-stage water injection in a single well in previously unfractured rock: (a) horizontal section at mid height of the model block, (b) and (c) perpendicular vertical sections through the center of the model block. Each plot shows element outlines of dimension 0.5 by 0.5 m in (a) and 0.5 by 1 m in (b) and (c). More information at https://doi.org/10.1016/j.jrmge.2023.07.009