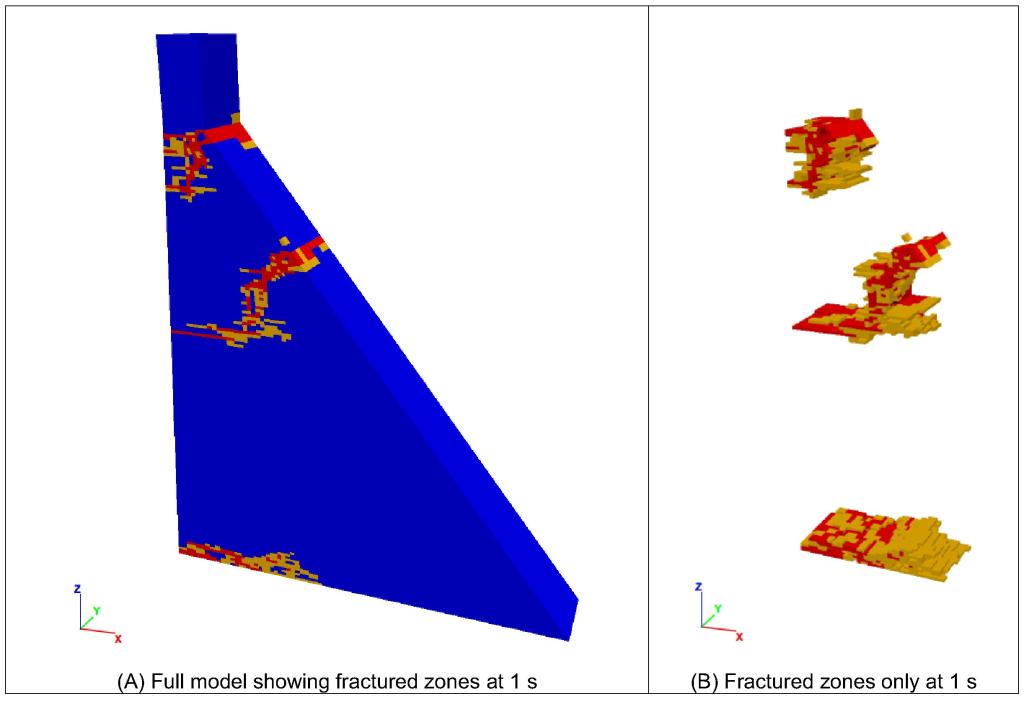
blue = unfractured, orange = one tensile fracture, and red = two fractures (tensile and shear). [From Ofoegbu GI and B Dasgupta (2021). Analysis of concrete dam response to dynamic loading using fracture-based modeling. USSD 2021 Annual Conference, held online, May 2021. https://ussd.conferencespot.org/2021/pdf/2021a069/2021fl069]
