The FBCM computer code CanFrac was used to simulate compression testing of a cylindrical specimen of concrete to demonstrate fracture energy. One simulation consists of cyclic compression-decompression testing and the other consists of monotonic loading. The cyclic loading test gives a peak strength of 22.5 MPa. In contrast, the monotonic loading test gives a peak strength of 45 MPa, equal to the input unconfined compressive strength. The reduced strength from the cyclic loading test indicates energy absorption due to motion (slip-mode and open-mode formation and post-formation motions) on fracture surfaces. In the cyclic loading test, fractures develop over a range of conditions during the test. Unlike the monotonic loading test, where fractures develop at the peak-strength state. Therefore, energy absorption due to fracture-surface motions is greater in the cyclic test than in the monotonic test.
The concrete specimen is cylindrical with height of 0.3048 m [12 in] and diameter of 0.1524 m [6 in]. The specimen was restrained vertically at the base and was subjected to all-round initial stress of 0.01 MPa. Cyclic compression-decompression was simulated by applying cycles of downward and upward velocity of magnitude 10^(-7) m/s at the top of the specimen. The cycles consisted of downward velocity for a time period, say ∆𝑡, followed by upward velocity for half the period, i.e., 0.5∆𝑡. Thus, the specimen was subjected to compression-decompression cycles with increasing shortening. The specimen has no pre-existing fracture and was assigned a Young’s modulus of 31.5 GPa, Poisson’s ratio of 0.15, unconfined compressive strength of 45 MPa, friction angle of 41°, and tensile strength of 4.05 MPa.
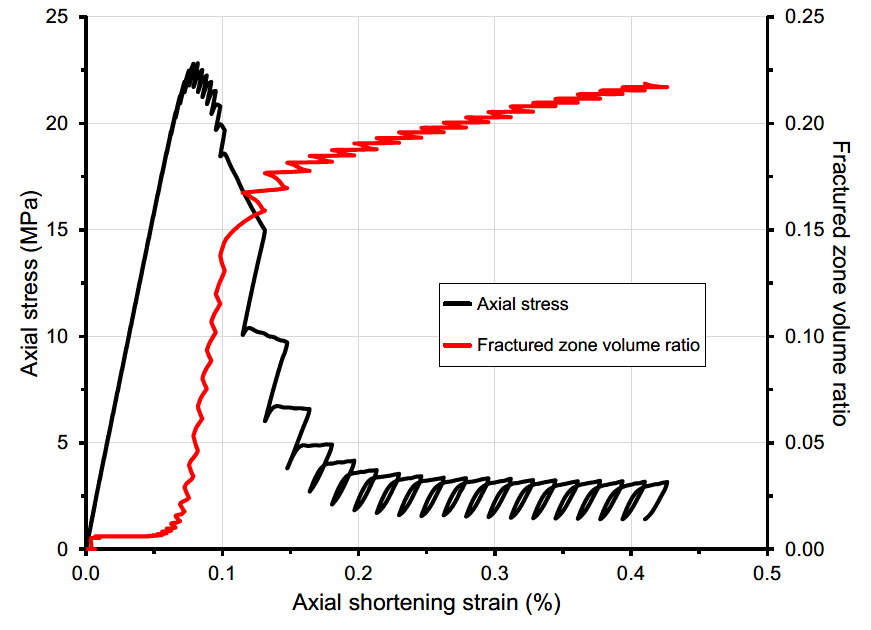

The cyclic loading test shows cycles of axial compressive stress versus shortening-strain and fractured-zone volume ratio versus shortening-strain (Figure 1). The stress-strain plot shows hysteresis that increased as the specimen fractured. Notice that the cyclic test gives a peak strength of 22.5 MPa, whereas the monotonic compression test (Figure 2) gives a peak strength of approximately 45 MPa.
In an FBCM model, fractures can deform in opening mode or slip mode and absorb energy as they deform. Energy absorption due to fracture deformation is greater in the simulated cyclic testing because fractures occur during a large range of conditions, unlike the monotonic loading test where fractures occur only near the peak-strength state. Compare fractured-volume plots in Figures 1 and 2. Because of energy absorption, fracture deformation causes natural damping under dynamic loading conditions and can affect the predicted mechanical response. For more discussion of natural damping due to fracturing in concrete, please see https://ussd.conferencespot.org/2021/pdf/2021a069/2021fl069.
