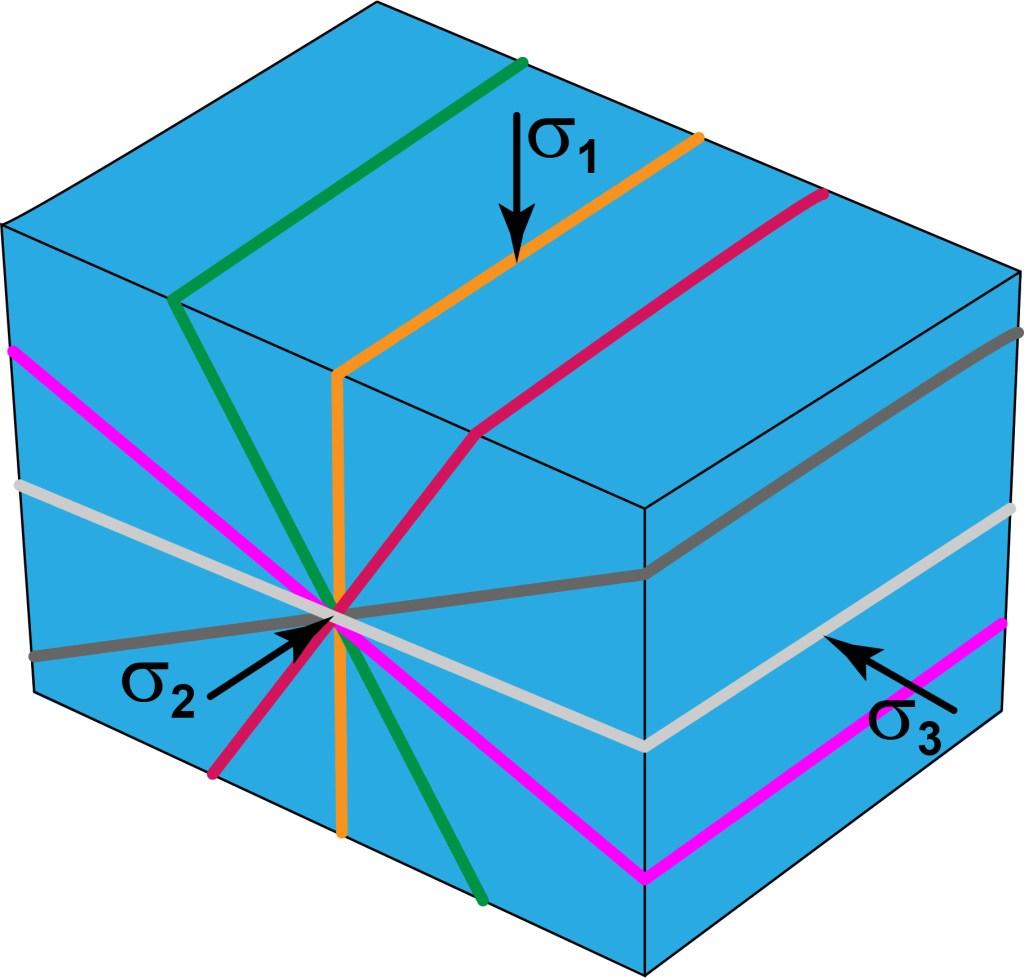
FBCM (fracture-based continuum modeling) does not implement any fracture mechanics rules to model fracture propagation. Instead, fractures may propagate in an FBCM model because of mechanical interactions among elements. A fractured element (e.g., Figure 1) presents fracture tips at the element faces that intersect the fractures. The element transmits fracture loading to neighboring elements via the fracture tips. Thus, each neighboring element that shares a fractured face with the fractured element is exposed to fracture-front conditions. A fracture propagates into a neighboring element if the element stress is adequate to initiate a segment of the fracture.
As an example, the vertical fracture (orange color) in Figure 1 transmits fracture-front conditions to four neighboring elements (not shown in the figure), into which the vertical fracture may propagate if the stress condition in the neighboring element is adequate.
This approach to modeling fracture propagation works the same way for static and dynamic loading conditions. This article provides an example for static loading conditions. The article on concrete dam integrity (https://geological-processes-modeling-research.org/examples/concrete-dam-integrity/) provides an example for dynamic loading conditions.
Fracture Propagation in an FBCM Brazilian Test Simulation
The Brazilian test simulation at https://doi.org/10.1016/j.rineng.2019.100070 that is reproduced in Figure 2 shows stages in the propagation of a vertical tensile fracture due to cylindrical compression of the rock disc (Brazilian test).
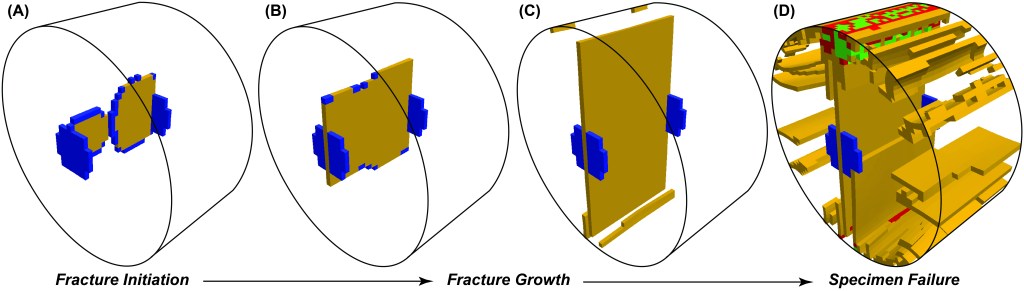
Figure 2(A) shows an initial stage when fractures had initiated at two locations inside the compressed disc and propagated upwards, downwards, and horizontally with an approximately elliptical front.
Figure 2(B) shows a subsequent stage when the two initial fractures had coalesced into a single tensile fracture that extended horizontally across the specimen and propagated upward and downward with approximately rectangular fronts.
Figure 2(C) shows a later stage when the fracture had propagated to a maximum height, but was still at a finite distance below the loading surface (top cylindrical surface of the specimen) and above the base support (base cylindrical surface of the specimen). The plot also shows secondary tensile fractures that initiated on the cylindrical surface of the specimen, and include two short and isolated fractures near the upper loading surface and two horizontally through-going but vertically short fractures near the lower support surface.
These plots illustrate fracture propagation in FBCM, controlled by element interactions and the applied loading. FBCM fracture propagation does not use any prescribed fracture-mechanics rules.
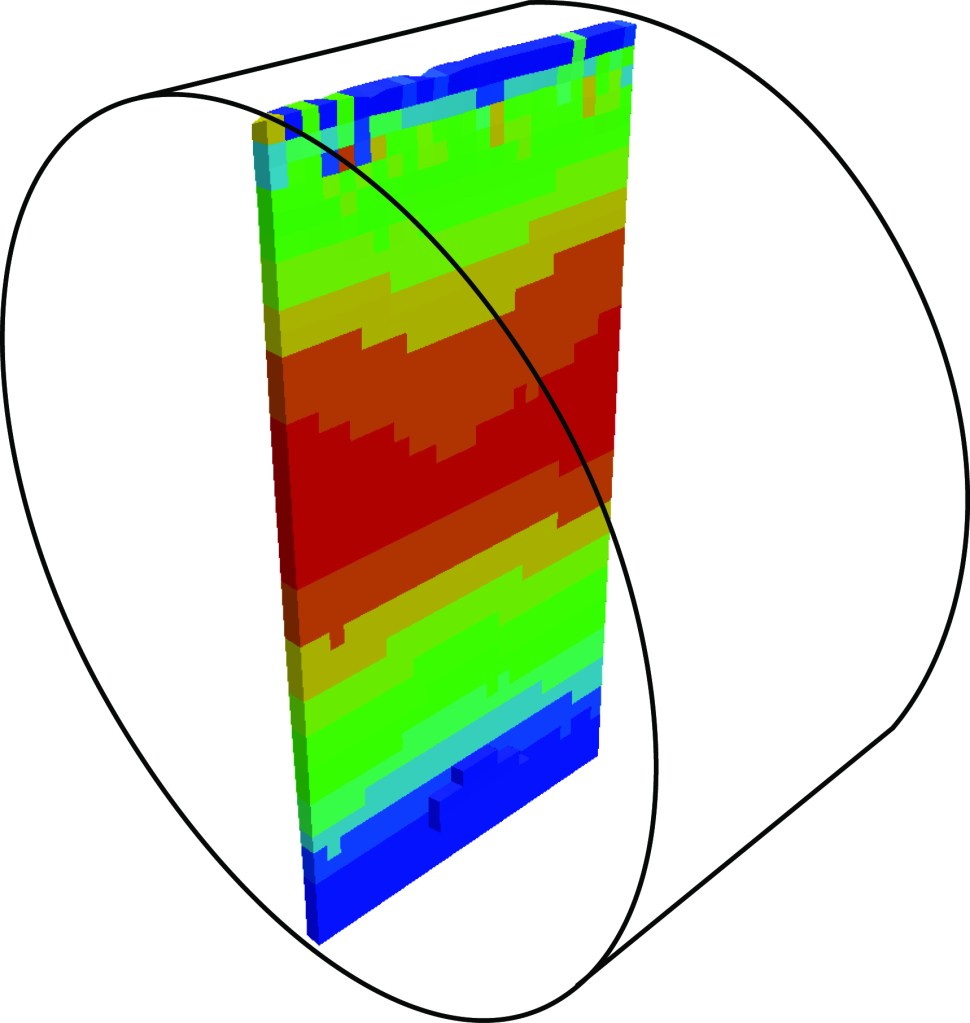
The main fracture shown in Figure 2 consists of several segments generated individually in several elements (one segment in each element). The aperture distribution (Figure 3) was assembled from the individual segments and shows a pattern consistent with the conceptual behavior of fracture aperture for the main fracture in the Brazilian test.